

Rent is the number everyone negotiates. Site quality is the number that sets the ceiling on how many patients you can see.
Six criteria carry most of the weight: demographics, competition density, visibility, access, space and build-out feasibility, and total occupancy cost. Score every shortlisted site against all six, whether you are opening a startup, moving an established practice, or adding a second location.
Demographics: match the population to your production model
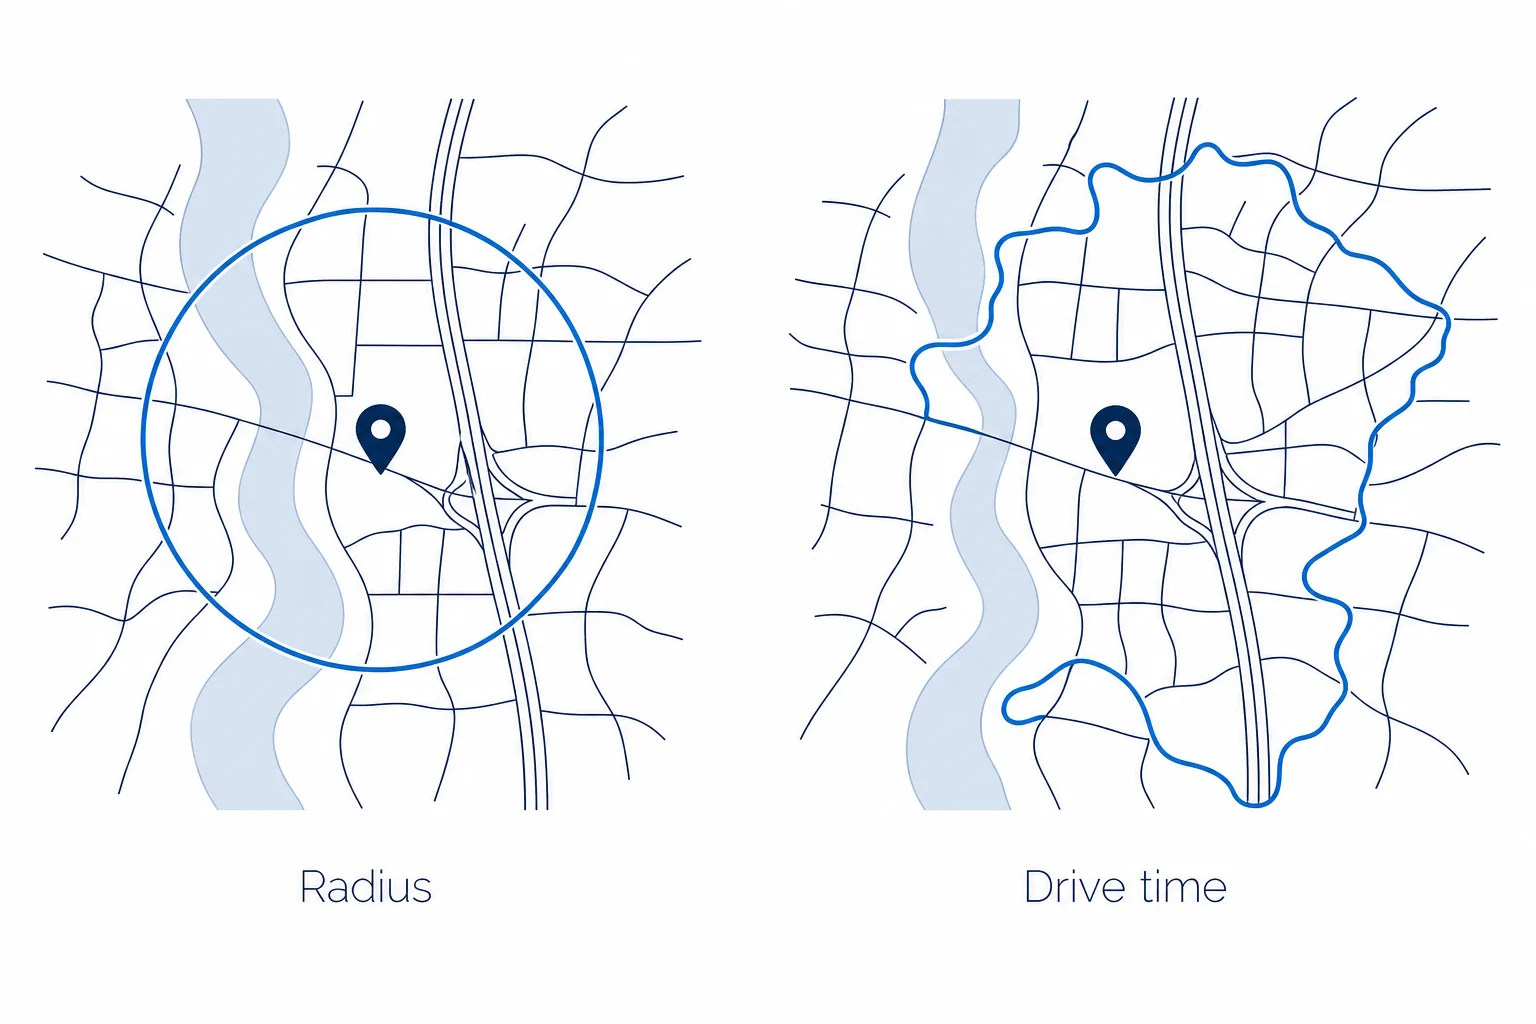
Pull data inside a defined drive-time ring (10 to 15 minutes), not a mileage radius. Highways, rivers, and rail lines decide who actually reaches you.
Review population growth, median household income, age distribution, household size, and insurance mix (PPO, Medicaid, fee-for-service), then match those to your service model. Pediatric practices need young families and school density. Implant and cosmetic production needs income and an older age skew. Census counts lag, so read residential permits and new rooftops for direction. If your schedule leans on working adults booking mid-day, weigh daytime employment as heavily as residential counts. Our guide to evaluating demographics for a dental practice location breaks down which variables to pull and where.
Competition density: count providers, not practices
One address can hold six dentists. Count providers, not signs.
Compare dentists per capita inside your trade area against the national benchmark: the American Dental Association counts 59.5 dentists per 100,000 people as of 2024, with meaningful variation by state. A ratio well above that deserves scrutiny.
Density is not saturation. A dense corridor where practices book three weeks out, or where several owners are near retirement, can be an opening. Check specialty gaps too: a trade area with no endodontist or pediatric practice creates referral flow in both directions. Insurance network overlap and DSO clustering tell you more than raw practice counts.
Dentist Density Across New York, New Jersey, and Connecticut
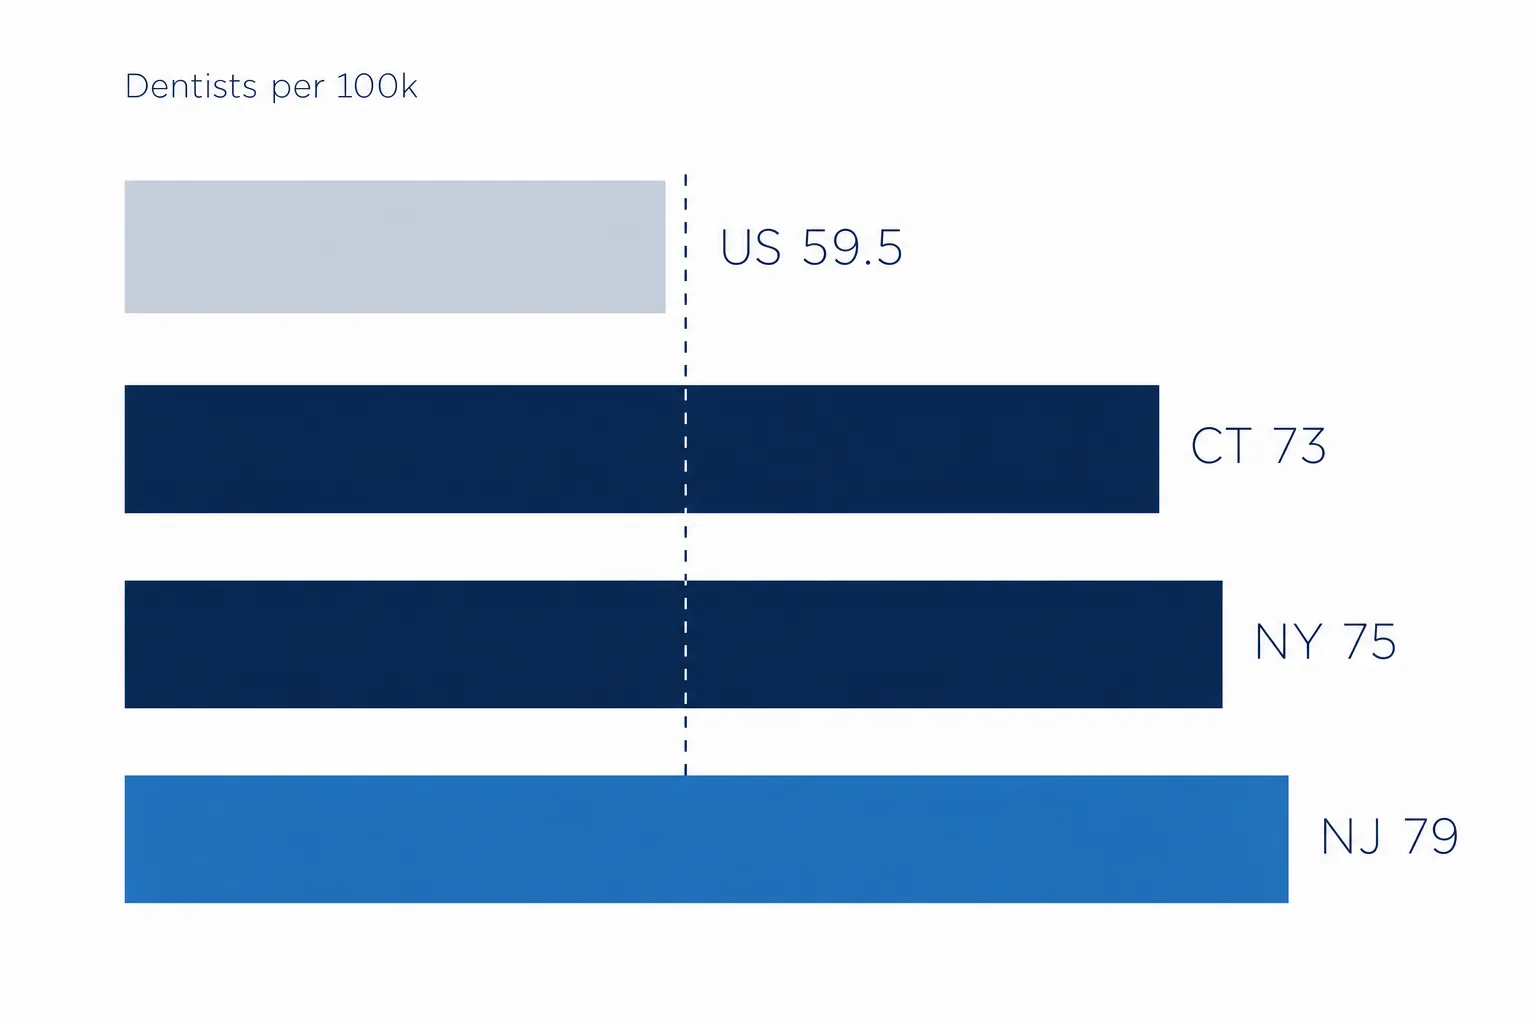
The national ratio is a starting point, not a verdict for this market. All three states in SQ/FT’s core footprint run above the national average of 59.5 dentists per 100,000 people:
| Market | Dentists per 100,000 (approx.) | Vs. national average |
|---|---|---|
| National average | 59.5 | Baseline |
| New Jersey | ~79 | About 33% denser |
| New York | ~75 | About 26% denser |
| Connecticut | ~73 | About 22% denser |
A site that clears the national benchmark with room to spare can still be a genuinely competitive market once it’s screened against these regional numbers instead. That raises the bar on the appointment-availability and owner-age checks already recommended above, they matter more here than they would in an average-density state.
Visibility, signage rights, and traffic patterns
Judge visibility from the dominant traffic direction, especially the evening commute side. Then confirm what you can actually put on the building. Signage is a negotiated lease right: monument panel, building fascia, and pylon position all need landlord consent and a municipal sign permit. Verify both before you price the site.
Traffic counts matter only when paired with an easy turn-in. A high-volume road with a median barrier or a restricted left turn can cost you more patients than it delivers. End-cap and corner positions carry a premium for a reason, and co-tenancy with a grocery, pharmacy, or coffee anchor generates passive impressions every week.
Access: parking, ingress, and accessibility
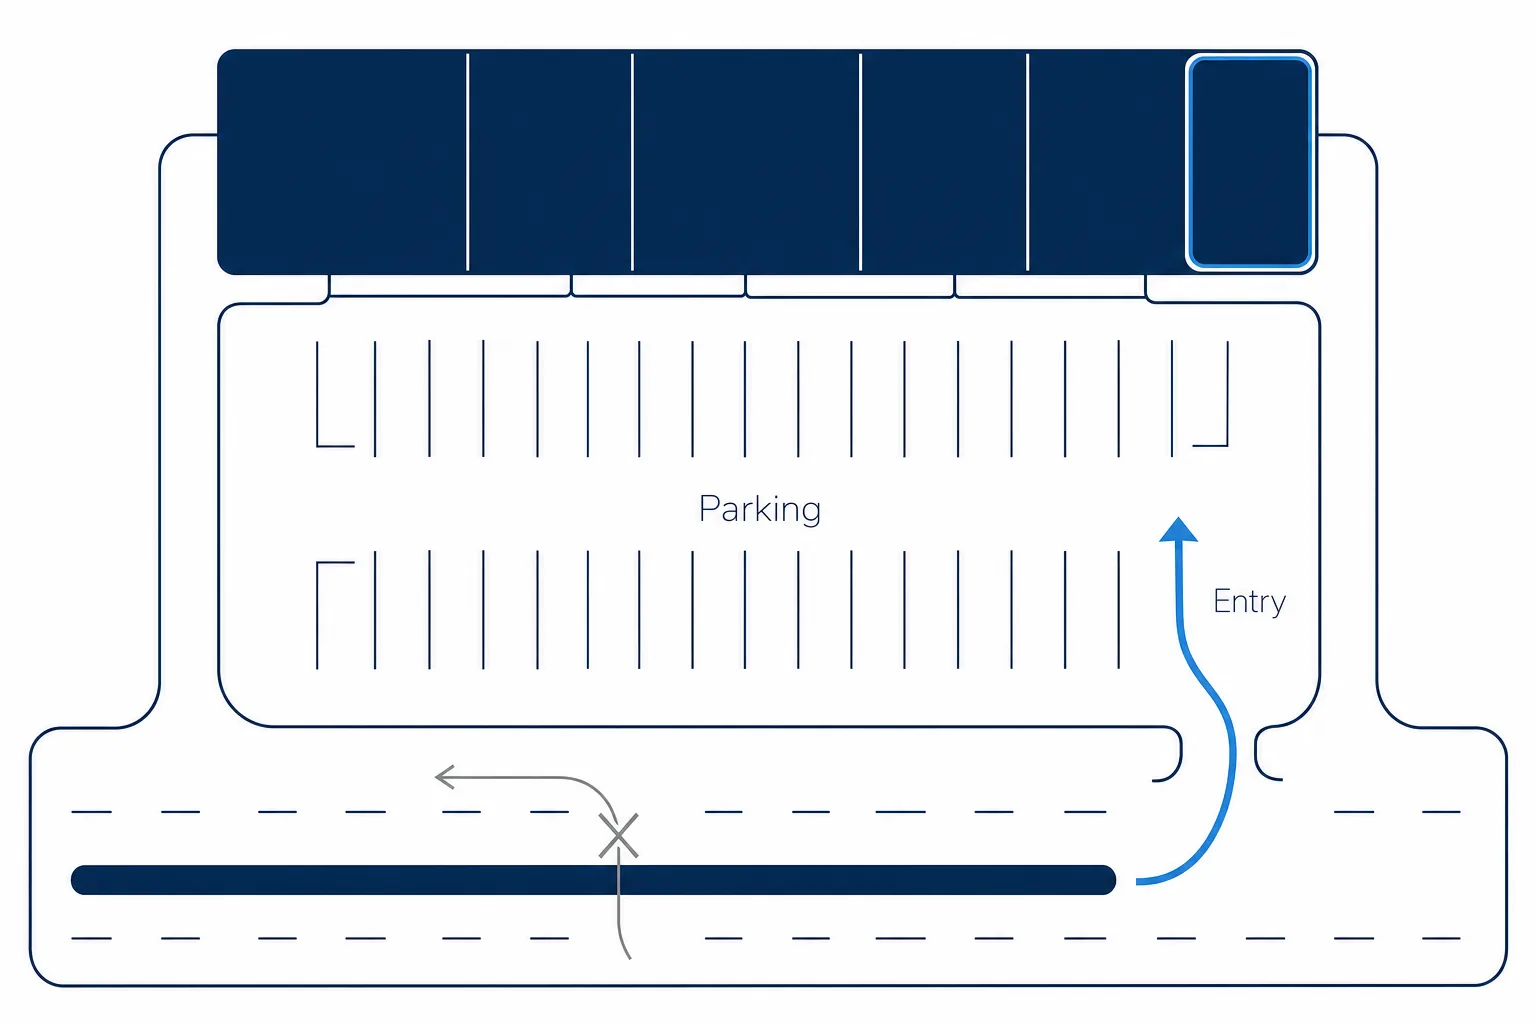
Check the parking ratio per 1,000 square feet, then ask whether it covers staff plus peak patient overlap. In a shared retail lot, a full lot at 5 p.m. turns into cancellations.
Evaluate ingress, egress, signalized entry, and turn restrictions. In urban trade areas, transit access and walkability replace parking as the deciding factor. Dental offices are public accommodations under the ADA, so accessibility covers both the suite and the path of travel from parking, and who pays for barrier removal belongs in the lease negotiation. Ground floor suites also serve elderly and post-sedation patients better than an upper floor on a single elevator.
Size the space to your operatory plan, not the asking rent
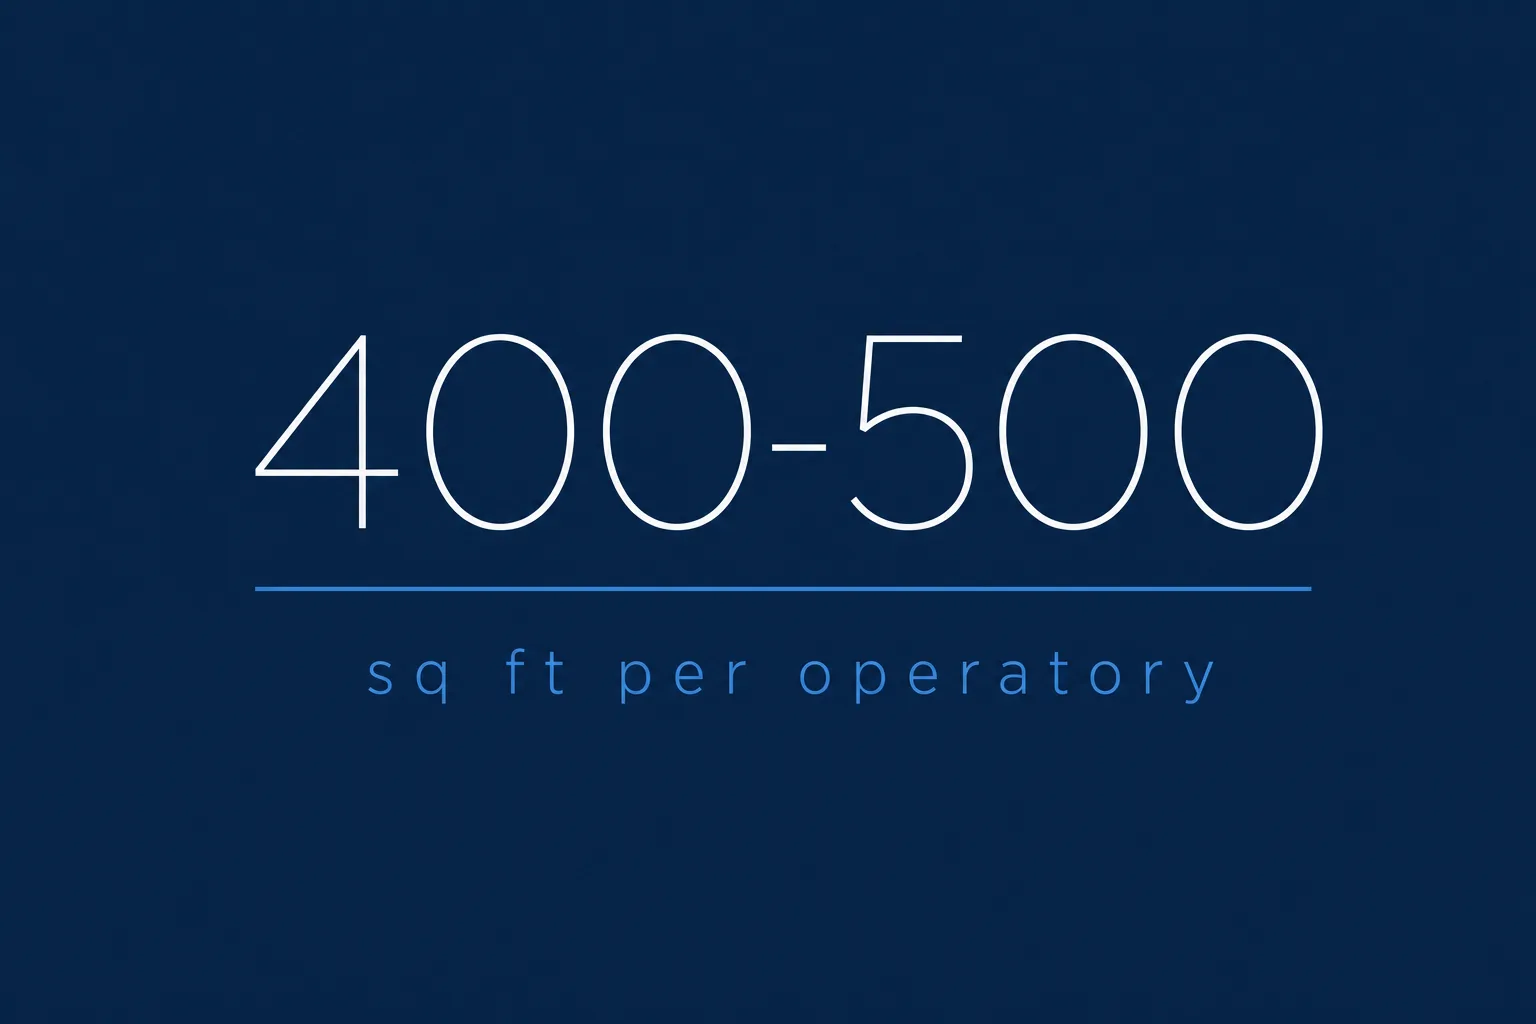
Work backward from your target operatory count, including rooms you plan to add in year five, then add sterilization, lab, imaging and CBCT, private office, staff lounge, mechanical, and reception. Planning guidance commonly allocates 400 to 500 square feet per operatory once support and circulation space is included, using the ADA’s own operatory-count-times-square-footage-divided-by-0.275 formula as the starting point.
Confirm whether the quoted square footage is rentable or usable, since load factor inflates the number you pay on. Shape constrains dental office floor plans as much as size: depth-to-frontage ratio, column spacing, and ceiling height for plumbing chases. Negotiate a right of first refusal on the adjacent suite so the site does not cap growth.
Build-out feasibility: zoning, utilities, and permits
This is the criterion most site selection lists skip, and it is where deals die.
Confirm that dental or medical office is a permitted use in the zoning district before you go to lease. Many retail districts treat medical use separately and require a conditional use permit, which adds months.
Then check the infrastructure. Second-generation dental space, raw shell, and retail conversion carry very different costs. Ask about slab plumbing feasibility, vacuum and compressed air routing, electrical service capacity, HVAC tonnage, water pressure, and shielding for imaging. State dental board and health department facility rules shape operatory design before an architect draws anything. Every week of permit delay is rent exposure without collections.
Occupancy cost and the lease terms that decide the deal
Judge rent as a share of projected collections, not as dollars per square foot in isolation. Published practice overhead benchmarks put occupancy cost at 5% to 8% of net collections, covering rent, taxes, insurance, CAM, utilities, and basic maintenance.
In higher-cost metro submarkets, including parts of SQ/FT’s own coverage area, that figure commonly runs 9% to 10%, which isn’t automatically a red flag if per-procedure collections in that market run higher too.
Beyond the rate, negotiate the terms that carry real money: tenant improvement allowance, free rent during construction, rent commencement tied to the certificate of occupancy rather than lease signing, and annual escalations. Two clauses protect long-term value. An exclusive use clause keeps a competing dental practice out of the same center.
Assignment and transfer rights protect your position when you eventually sell the practice. Ask about personal guaranty burn-off, and about an option to purchase if ownership is on your roadmap.
Lease vs. Buy: How Ownership Changes the Site Selection Calculus
Everything above assumes a lease. Buying changes the math on several of the same criteria, not just the financing.
SBA 504 loans let an established practice purchase owner-occupied real estate with as little as 10% down, against the 20% to 30% conventional lenders typically require for the same purchase. The tradeoff is the occupancy rule: the practice has to occupy at least 51% of the space, which limits how much extra building you can buy and lease out to someone else. Build-out costs bite harder too.
Dental-specific plumbing, vacuum, and compressed air systems can add 20% to 40% on top of the base real estate price, and unlike a leasehold improvement offset by a landlord’s TI allowance, that money is fully owner-funded and isn’t recovered if the practice sells before it’s built equity.
Related readingMedical Practice Expansion Checklist (2026 Guide)Read the guide →| Leasing | Buying (SBA 504) | |
|---|---|---|
| Upfront cost | Negotiated TI allowance, low cash outlay | As little as 10% down |
| Occupancy requirement | None | Must occupy at least 51% of the space |
| Build-out cost exposure | Often partly offset by landlord TI | Fully owner-funded |
| Long-term cost trajectory | Rent escalations, no equity built | Fixed-rate payments, builds equity |
| Flexibility to relocate | Higher, lease term ends | Lower, tied to the asset |
| Common ownership structure | Direct lease with landlord | Separate real estate LLC leases back to the practice at fair market rent |
Many owners split the real estate from the practice on paper: a separate holding LLC buys the building and leases it back to the operating entity at or below fair market rent. Same person controls both, but the practice and the real estate stay on separate books, which matters later if the practice sells and the building doesn’t.
Relocating an existing practice changes the weighting
For a startup, demographics dominate. For a move, distance from the current site drives patient retention, so map your active patient base before you shortlist anything. Staying inside your existing patient concentration and referral network preserves value you already built.
Build overlap period, downtime, and equipment transfer costs into the comparison, and check any non-compete or restrictive covenant from a prior partnership, which can eliminate otherwise excellent sites. Our dental practice relocation guide covers how location choice decides whether a move pays off.
Turn the criteria into a weighted scorecard
Apply disqualifiers first: zoning prohibition, no signage rights, inadequate parking, no exclusivity available. Anything that fails those is off the list regardless of rent.
Weights should sum to 100. Multiply each score by its weight, then add the column. Here’s a worked example, a flashy high-visibility retail corner (Site A) against a quieter medical building with better access and lower rent (Site B), figures below are illustrative only:
| Criterion | Weight (out of 100) | Site A score (1 to 5) | Site A weighted | Site B score (1 to 5) | Site B weighted |
|---|---|---|---|---|---|
| Demographics | 25 | 4 | 100 | 4 | 100 |
| Competition density | 15 | 3 | 45 | 4 | 60 |
| Visibility | 15 | 5 | 75 | 2 | 30 |
| Access | 15 | 3 | 45 | 4 | 60 |
| Space and build-out feasibility | 15 | 3 | 45 | 4 | 60 |
| Occupancy cost | 15 | 2 | 30 | 4 | 60 |
| Weighted total | 100 | 340 | 370 |